Digging into ETF expenses can really pay off in the long run. Understanding the true cost of holding an exchange traded fund often goes a lot deeper than just checking the expense ratio. Even small differences in expenses have a way of adding up, especially if you’re in it for the long haul. I’ll walk through some of the more advanced strategies I use to get a solid grip on ETF expenses, moving well beyond just glancing at the numbers in a fund’s summary.
Disclaimer: This article contains affiliate links. If you open an account through these links, I may earn a commission at no additional cost to you. Investing involves risk, including the possible loss of capital. eToro is not available in all countries. Eligibility depends on your region. Always consider your individual circumstances before investing.
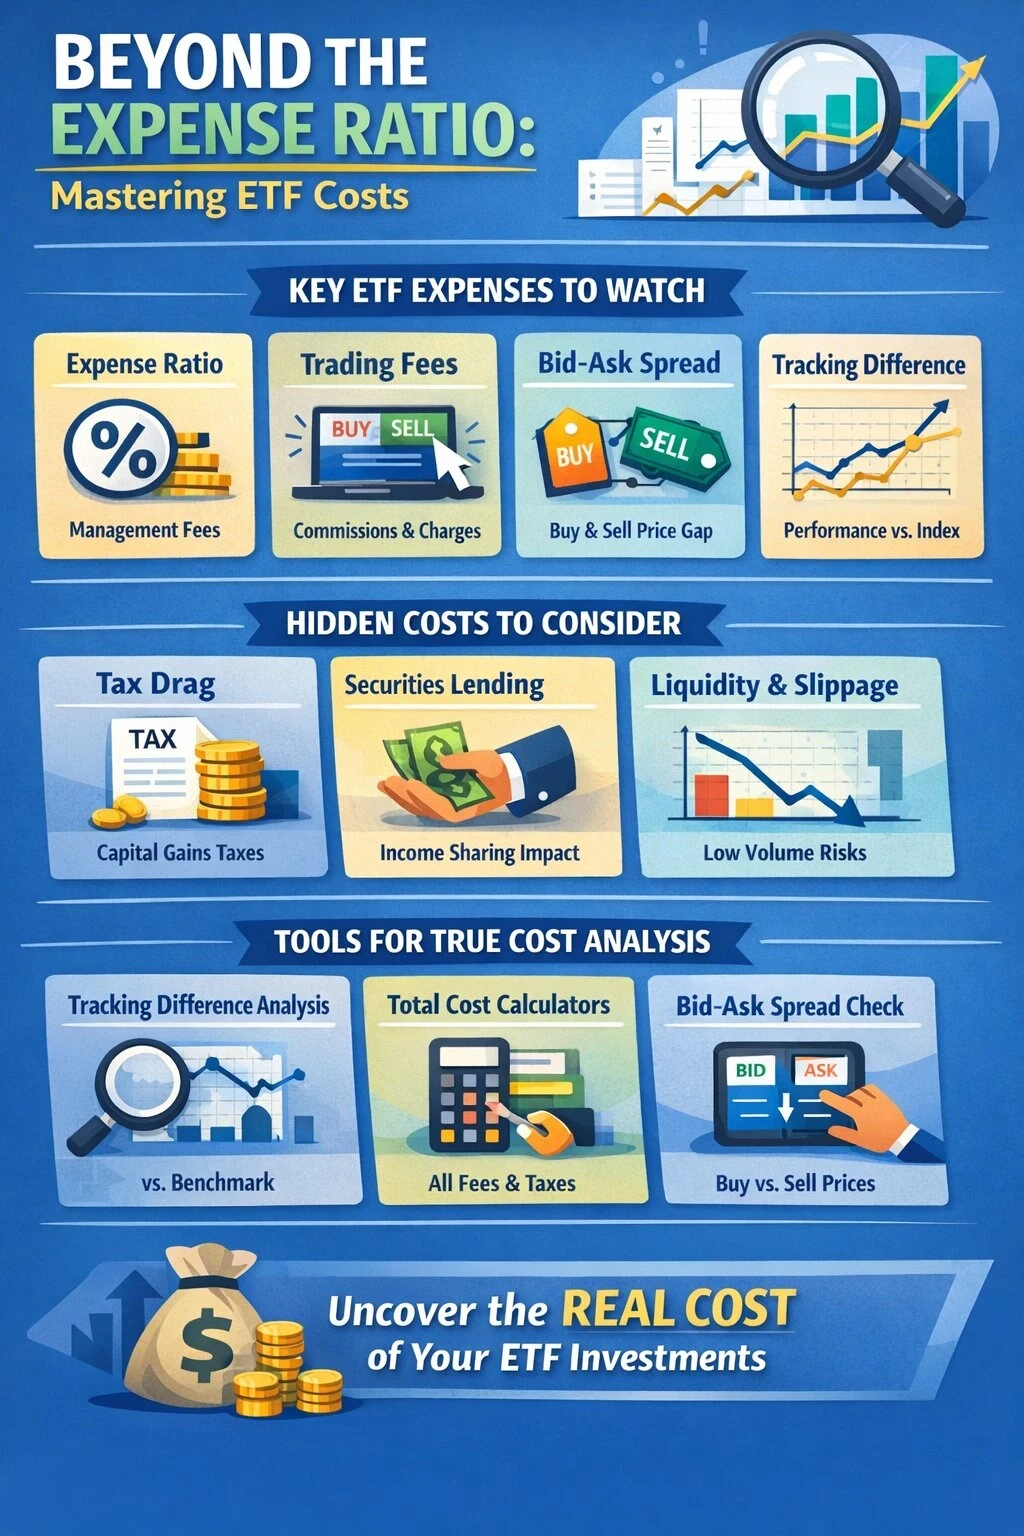
Breaking Down the Most Common ETF Expenses
First up, it helps to get familiar with the basic fees you’ll see listed for most ETFs. Expense ratio is the headline figure, but there’s more under the surface. These are the main costs I always factor in before making any ETF investment:
- Expense Ratio: This is the yearly fee that covers fund management and administrative overhead. It’s shown as a percentage of your assets in the fund. While many index ETFs keep this pretty low (often under 0.10%), other types can run higher.
- Commissions and Trading Fees: Some brokers still charge to buy or sell ETFs. Even when these commissions are small, active traders might rack up extra costs. Brokerage choices like eToro and TradingView can be worth checking for lower or commission-free trades.
- Bid Ask Spread: This is the small difference between the price you pay to buy the ETF and the price you’d get when selling immediately. It can feel minor, but with large trades, the impact grows.
I like to read more about these basics in this ETF expenses explainer. For most people, getting these fundamentals down makes advanced analysis a lot more valuable.
Digging Into Hidden and Indirect ETF Costs
Sometimes costs don’t appear in the expense ratio or any broker invoice at all. Here’s what I watch out for if I’m aiming for a truly accurate cost comparison:
- Tracking Difference: This shows how much the ETF’s actual return differs from its benchmark index. Sometimes the fund lags in ways that aren’t explained by just the expense ratio; maybe due to internal trading or tax drag.
- Tax Efficiency: Some ETFs rack up bigger capital gains, especially if they trade a lot behind the scenes or hold less liquid assets. U.S. ETFs using in-kind redemption can be super tax-efficient, while others aren’t as careful.
- Securities Lending Revenue: Some funds lend out their portfolio stocks or bonds for a fee, reducing your overall expenses, but only if the fund manager actually shares that benefit. I try to look for disclosures about this extra income in the ETF’s prospectus.
I’ve found that understanding securities lending can actually make a notable difference in overall cost. In some cases, the manager keeps the income, giving you no benefit, while others share the bulk with shareholders. Even subtle differences in the transparency of these practices add up for long-term investors.
Using “True Cost” Calculators and Tools
The expense ratio alone only tells part of the story. For a more complete picture, I like to use online calculators and ETF research tools. These tools bring hidden costs out into the open and let you compare “apples to apples” between funds.
- Websites like TradingView and BudgetETFs have ETF screeners that pull up longterm tracking differences, effective tax rates, liquidity info, and current bid-ask spreads.
- “Total Cost of Ownership” calculators factor in all these expenses and even help estimate longterm performance drag. I find this especially useful for taxable accounts or when holding for five years or more.
Knowing how to use these tools can be a game-changer for seeing past just the headline fee numbers. For instance, if two ETFs have similar published fees but one has a consistent tracking difference every year, that’s a sign there’s something else at play you need to consider.
Key Pitfalls to Watch Out For in ETF Cost Analysis
Some ETFs are known for being low-cost, but sometimes a cheap expense ratio hides other costs that are easy to overlook. Here’s what I see as the main pitfalls:
- Trading LowVolume ETFs: Thinly traded funds often have wider bid-ask spreads and bigger pricing swings. It’s best to check average trading volume directly in tools like TradingView.
- Ignoring Tax Consequences: Even with the same expense ratio, some funds generate big taxable events, especially actively managed funds or those holding MLPs or international equities.
- Switching Funds Frequently: Frequent traders risk racking up extra fees, spreads, and taxes. Sometimes it’s smarter to pick a core fund and stick with it long-term, unless a major rebalancing really makes sense.
Example: The “Low Cost” That Wasn’t
I once picked an ETF mainly because of a super low expense ratio. Turns out, this fund rarely traded, leading to a bid-ask spread that was over 0.20%. On top of that, the tracking difference was twice the expense ratio, eating into returns even more. Careful research really helps buyers make informed decisions.
Comparing Similar ETFs: Practical Strategies
When two ETFs track the same index, they’re not always equally cost-effective. Here’s how I’ll usually compare them:
- Check tracking difference over 35 years, not just expense ratio.
- See if either fund offers securities lending revenue shared with shareholders.
- Review bid ask spreads using your broker’s quote tools or a resource like TradingView.
- Compare how frequently the ETF distributes capital gains. Tax drag can erase fee savings fast.
- For large accounts, see if institutional share classes or ultra-low-cost share classes exist. Sometimes brokers like eToro offer extra perks or rebates on certain ETFs, so that’s worth a look too.
Latest Trends in ETF Expense Ratios
ETF expense ratios have dropped a lot over the last decade, and some funds even claim to be “zero fee.” While this is good news for investors, it’s important to look out for potential tradeoffs in liquidity, tracking differences, or added risks with newer ultra-cheap funds. Staying updated on recent ETF expense ratio trends can help you spot whether a new launch actually fits into a smart cost-minimizing strategy. For example, popular ETF providers might offer teasers like limited-time low-fee promotions; these can change as the fund attracts more assets, so it’s worthwhile to keep reviewing the fee structure every so often.
Frequently Asked Questions
Here are answers to some questions I’m often asked about analyzing ETF expenses:
Do expense ratios include every possible cost?
No, expense ratios just cover management and operational expenses. Other costs like bid-ask spreads, taxes, and trading commissions don’t appear in the expense ratio, so I always factor them in separately.
Why do two ETFs tracking the same index have different returns?
Tracking difference is usually the reason. One fund might be trading more efficiently, managing taxes better, or sharing more securities lending revenue. Looking at actual long-term performance gives you a clearer idea than just using fee tables.
Should I worry about ETFs that say they have “zero fees”?
Zero fee funds often make up costs somewhere else, like wider spreads, lending out securities, or introducing new risks. I always check out the prospectus and fund performance details before picking an ultralow-fee ETF.
Putting Advanced ETF Cost Analysis into Practice
Investing in ETFs gets a lot more effective when you start using advanced expense analysis. By digging into tracking differences, tax factors, and using total cost of ownership tools, it’s easier to spot which funds really help you keep more of your returns. For anyone who wants to read more and see specific examples, this detailed breakdown on ETF expense analysis is worth checking out.
Careful research and a smart toolkit can really give you an edge in long-term investing. No single number tells the whole story, but by putting together expense ratios, hidden fees, and tax efficiency, it’s totally possible to get a much clearer read on your investment costs, and avoid expensive surprises down the road!